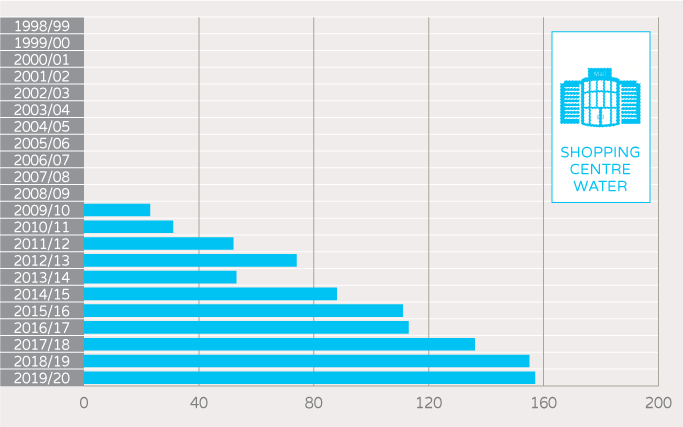
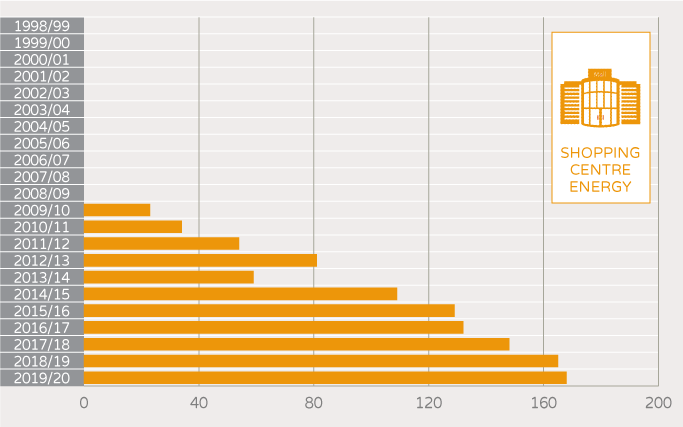
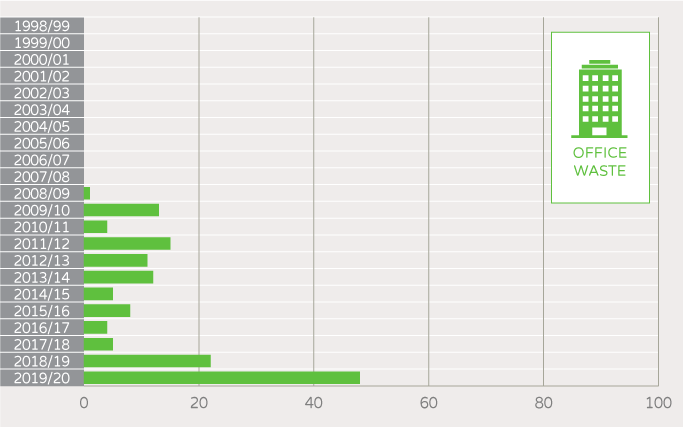
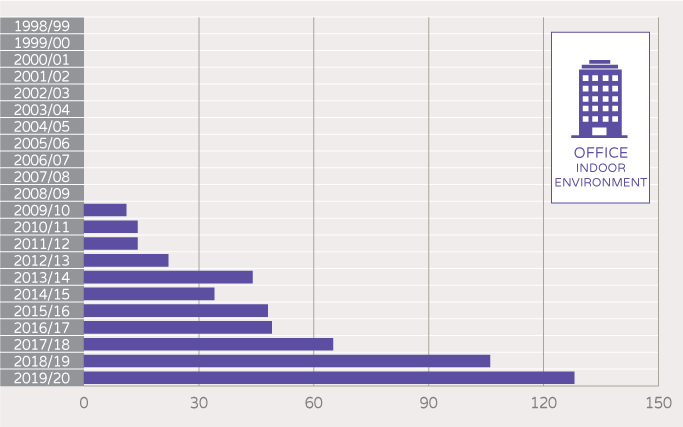
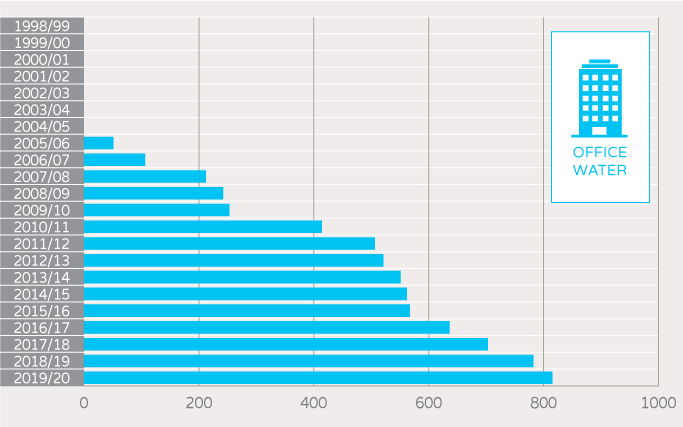
Number of individual buildings rated AT LEAST ONCE OVER THE LIFE OF THE PROGRAM
National market penetration NABERS OFFICE TOOLS
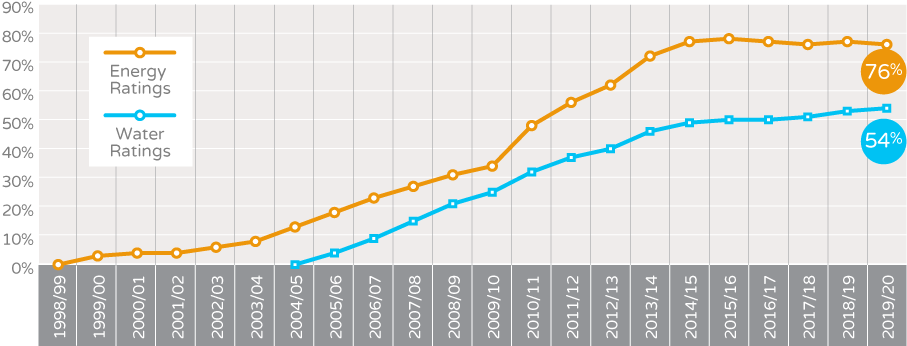
Note: The Market Penetration calculation has been revised to only include the total area of rated buildings for a 5-year rolling period.
This is because some rated offices have been retired from use and no longer make up the total available office stock (m2).
Previous calculations included all rated buildings since FY99.
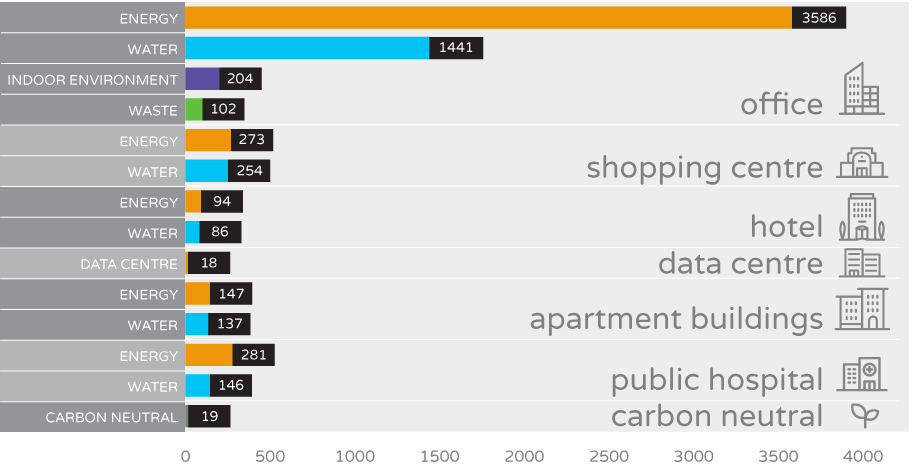
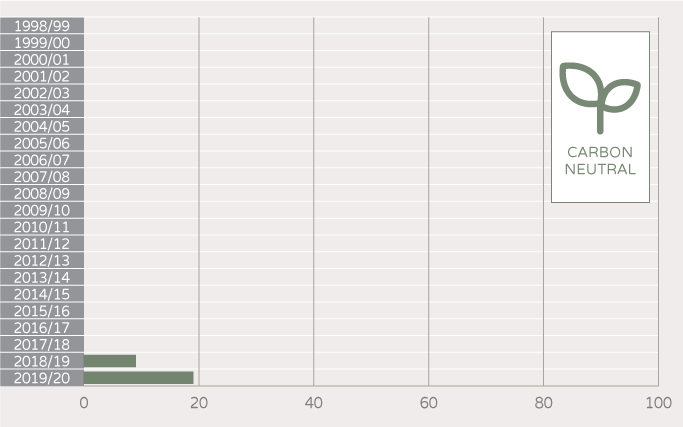
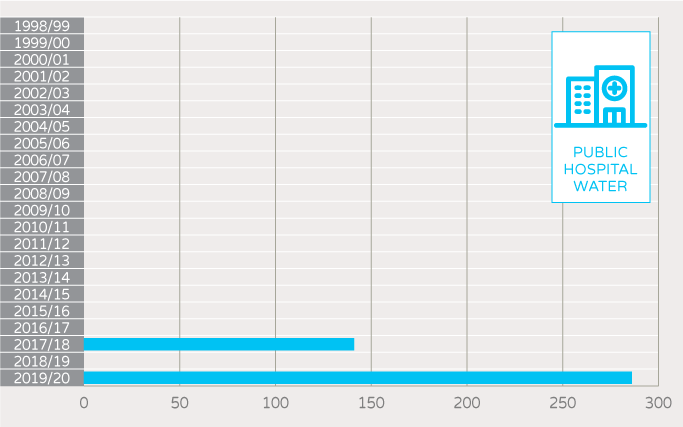
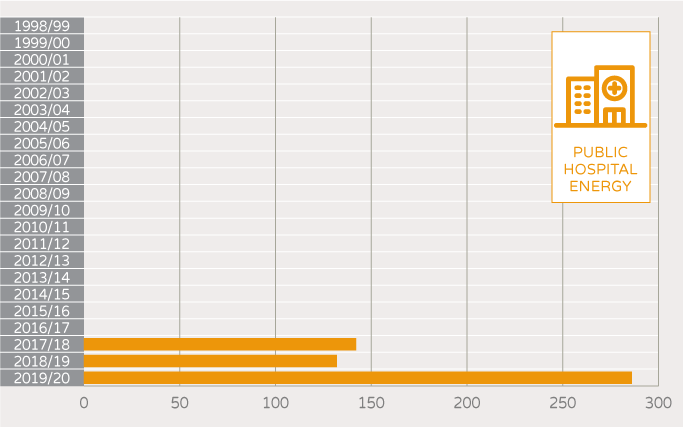
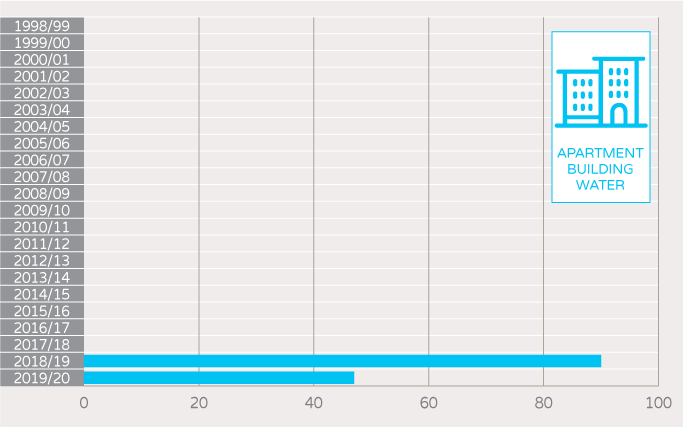
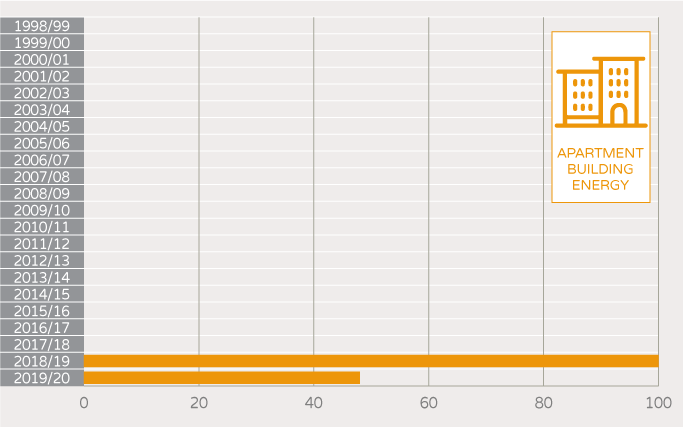
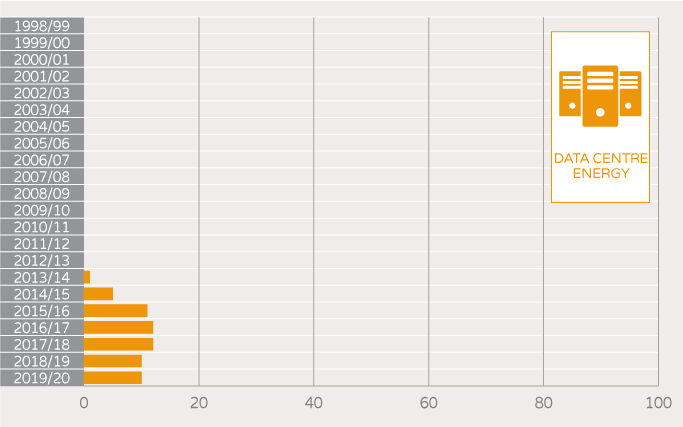
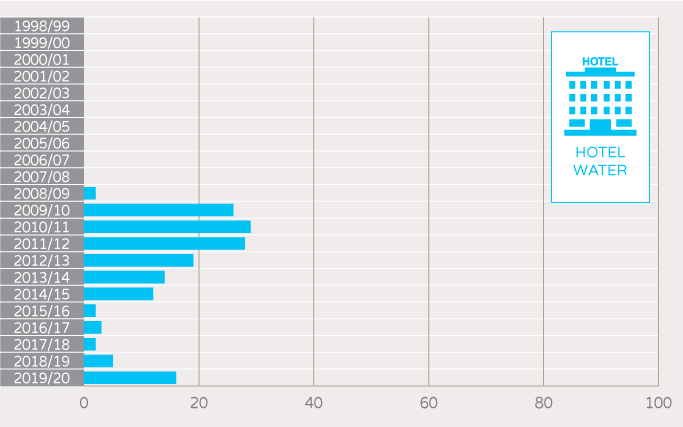
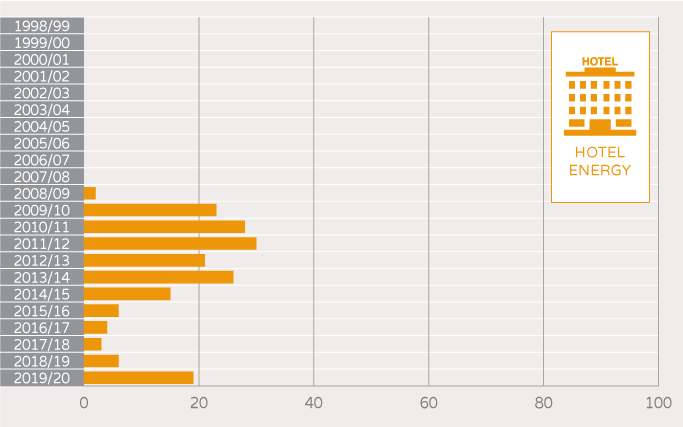
Number of unique buildings and tenancies rated BY TOOL TYPE
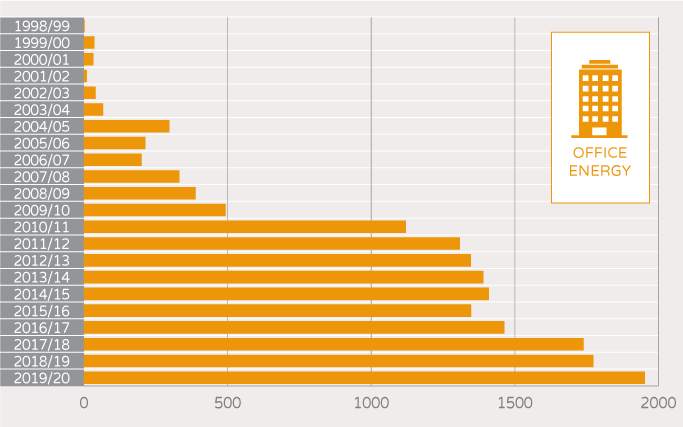
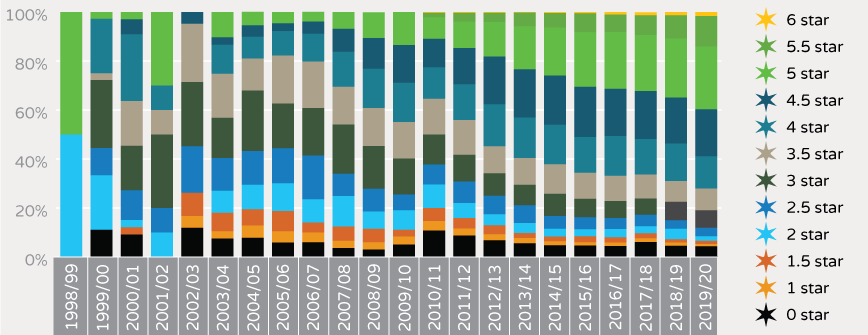
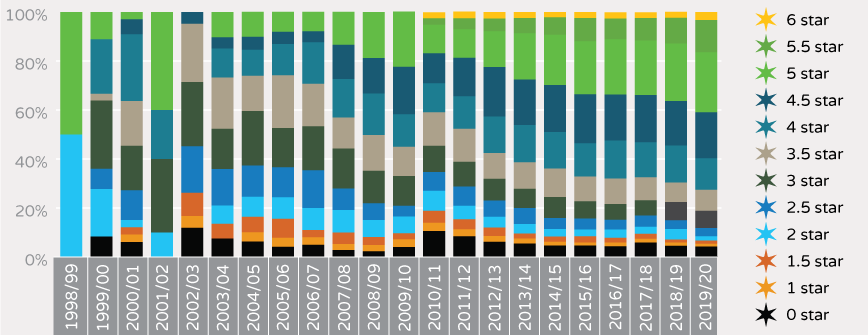
Distribution % of Office Energy ratings OVER THE LIFE OF THE PROGRAM
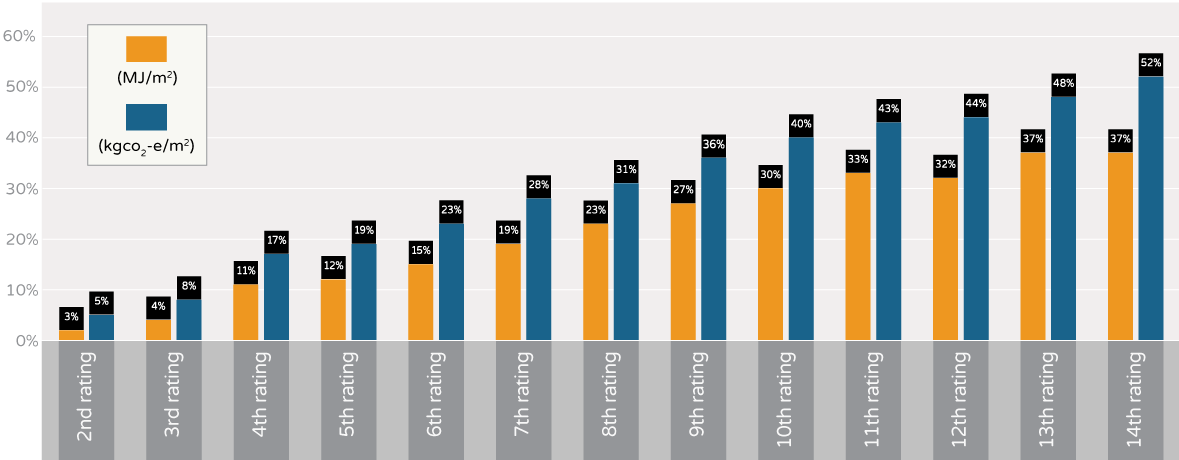
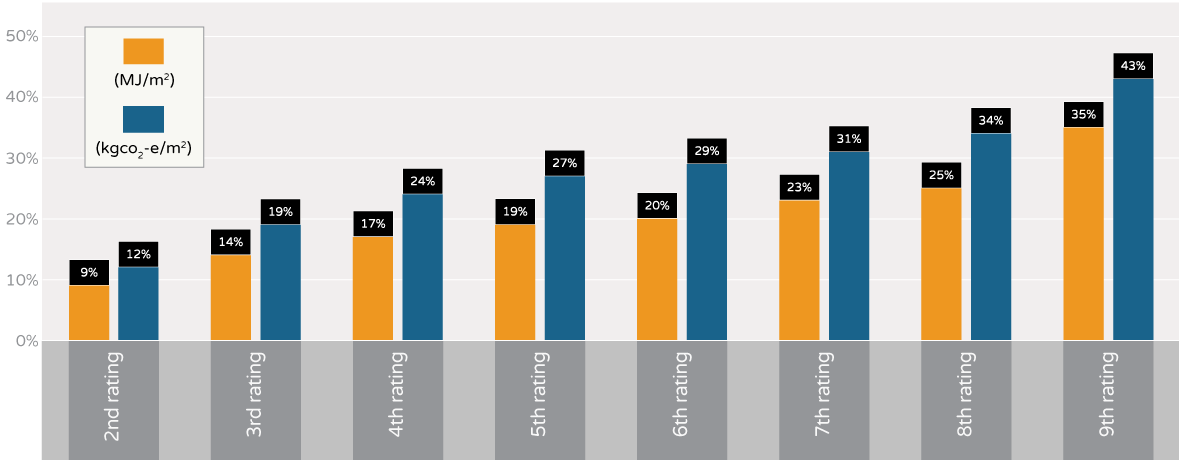
Average reduction in energy use after multiple ratings NABERS ENERGY FOR OFFICES (Base and Whole Buildings)
Average reduction in energy use after multiple ratings NABERS ENERGY FOR SHOPPING CENTRES
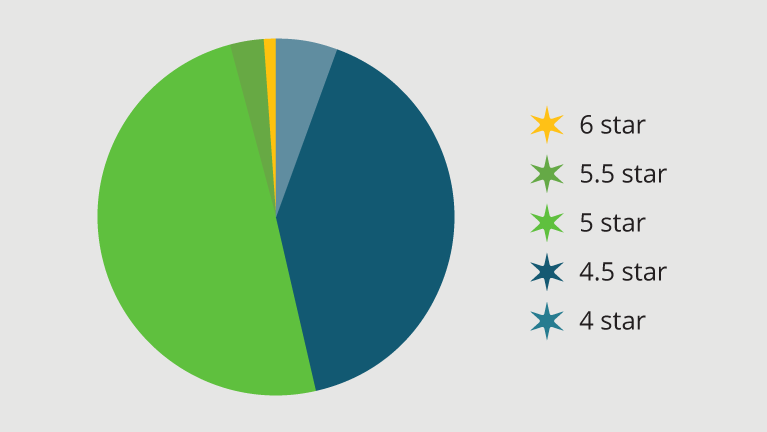
NABERS Energy Commitment Agreements TARGETED STAR RATINGS OVER THE LIFE OF THE PROGRAM
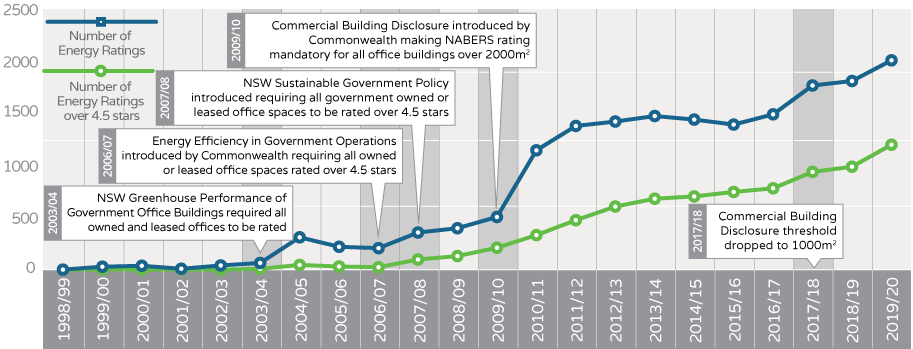
Ratings and government policy NABERS ENERGY FOR OFFICES (BASE BUILDING, WHOLE BUILDING + TENANCY RATINGS)
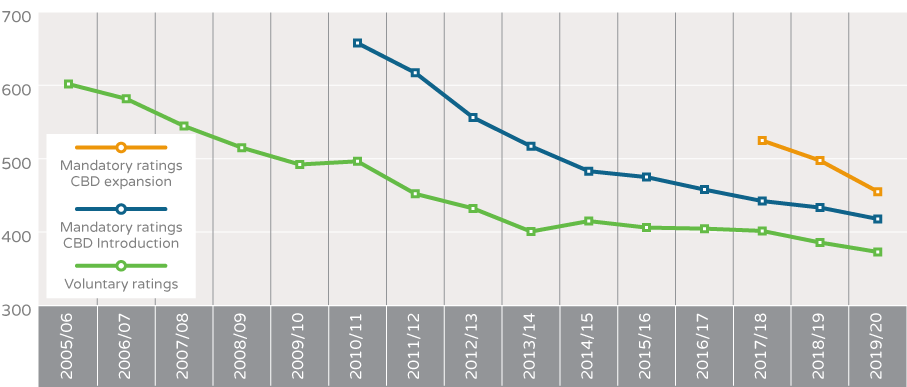
Improvements in average energy intensity (MJ/m2) FOR VOLUNTARY VS MANDATORY RATING
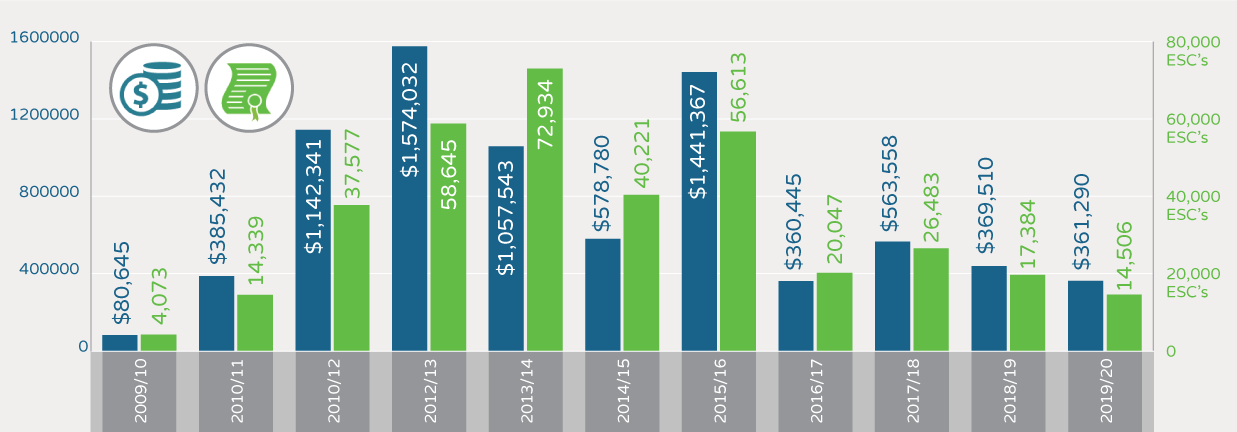
NSW Energy Savings Scheme ENERGY SAVINGS CERTIFICATES and $ CLAIMED USING THE NABERS METHOD PER YEAR